Descriptive and Inferential Statistics

Image by Michael Siebert. Downloaded from pixabay.com

Since I posted “Challenges in Exploratory Data Analysis” (February 1, 2021), I found myself struggling with the distinction between Exploratory Data Analysis and Confirmatory Data Analysis on one hand, and the distinction between Descriptive Statistics and Inferential Statistics on the other. The former distinction is relevant to what you can say with any one set of data and what you can say with more than one data set; while the latter distinction comes into play when deciding whether our interest lies in the sample at hand or on the process generating the sample we have (the population). 

Clarifying these distinctions is more than an academic exercise: doing so, and understanding how the terms are used, help us understand what we can say with the data and what we cannot, what assumptions we are making when inferring from the data and at what point in our analysis we are making those assumptions. It helps develop our own guidelines for disciplining our thought process when thinking with data.

According to Wikipedia (Wikipedia contributors 2021a), Exploratory Data Analysis was promoted by US mathematician John Tukey in the 60s and 70s, as a way of unearthing hypotheses to be tested with data before jumping onto testing hypotheses based on assumptions made. It was to be in contract with Confirmatory Data Analysis (hypothesis testing). It was a way of exploring what information was contained in the data, independent of any already existing hypotheses about the relevant subject matter. It included a myriad of techniques such as looking at variable maximums, minimums, means, medians and quartiles, but was characterized more by the attitude than the techniques. A number of techniques applied in exploratory data analysis can be applied whether our focus is on the sample at hand (descriptive statistics) or the underlying generating process (inferential statistics). In thinking about these concepts, I produced the diagram below, that is useful to me, may be useful to others as well (I used mostly my accumulated knowledge at this point, but suggest readers start with Wikipedia entries for Descriptive Statistics [2021b] and Statistical Inference [2021c] for further reading).
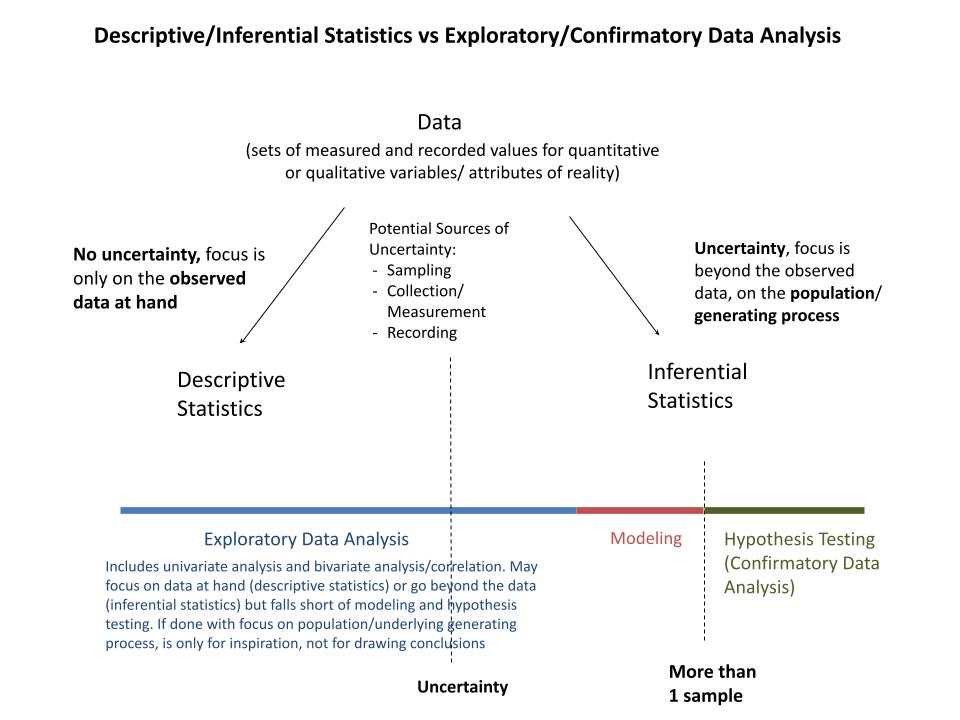
Source: author's take

Although exploratory data analysis techniques can be applied whether our focus is on the sample at hand or the underlying generating process, how things are done in each case may be different. In the table below I tried to establish some distinctions on how we would proceed with exploratory data analysis in descriptive and inferential statistics.
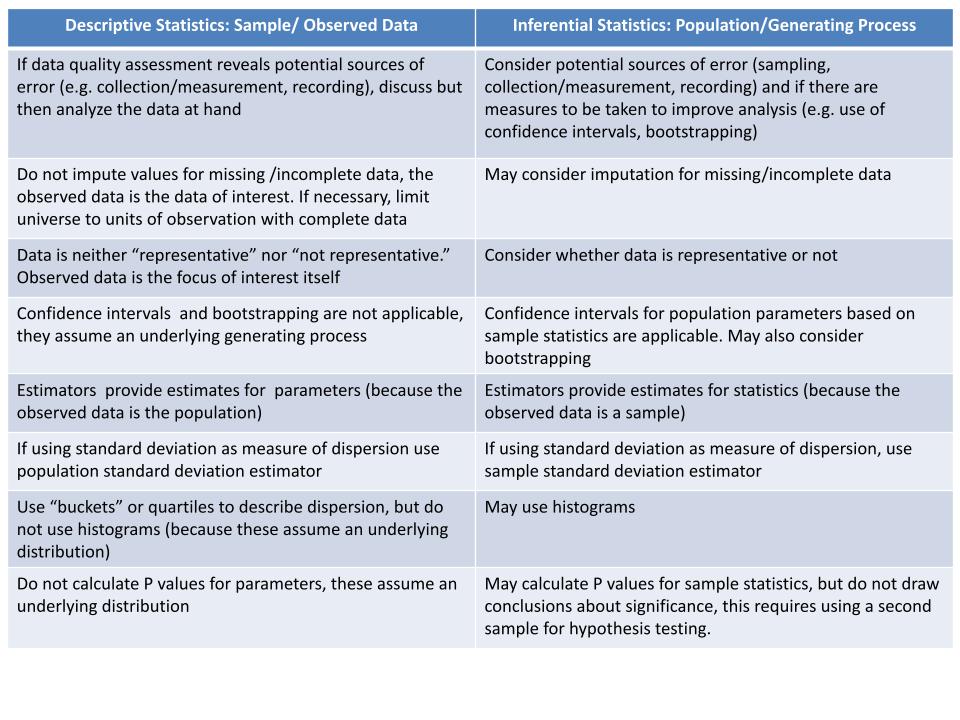
Source: author's take

 In either case, during exploratory data analysis, we do not talk about significance of correlation, causality or hypothesis testing. These require modeling and a second sample drawn from the same population (or treatment and control groups).

A final note on the terms used by Cassie Kozyrkov in her popular blogs and vlogs (Kozyrkov 2018; 2019a; 2019b; 2020).  She refers to data analytics as being used when there is no uncertainty (what I refer to as descriptive statistics) and refers generally to statistics when there is uncertainty (what I refer to inferential statistics). She also refers to data analytics as being for inspiration (what I refer here as exploratory data analysis), as opposed to hypothesis testing, that would require another sample. From what I can tell from the literature, these are less traditional uses of the terms and I find the traditional uses (what I believe I capture here) seem to better highlight the difference between analyzing sample and population data. 

References

Kozyrkov, Cassie. 2018. “Don’t Waste Your Time on Statistics.” Towards Data Science. May 29. Available: https://towardsdatascience.com/whats-the-point-of-statistics-8163635da56c. Accessed: May 23, 2021.

———-. 2019a. “Statistics for People in a Hurry.” Towards Data Science, May 29. Available: https://towardsdatascience.com/statistics-for-people-in-a-hurry-a9613c0ed0b. Accessed. May 23, 2021.

———-. 2019b.  “The Most Powerful Idea in Data Science.” Towards Data Science. August 09. Available: https://towardsdatascience.com/the-most-powerful-idea-in-data-science-78b9cd451e72. Accessed: May 23, 2021

———- 2020. “How to Spot a Data Charlatan.” Towards Data Science. October 09. Available: https://towardsdatascience.com/how-to-spot-a-data-charlatan-85785c991433. Accessed: May 23, 2020. 

Wikipedia contributors, 2021a.”Exploratory data analysis.”  In Wikipedia, The Free Encyclopedia. Available: https://en.wikipedia.org/w/index.php?title=Exploratory_data_analysis&oldid=1021890236. Accessed May 15, 2021.

———-. 2021b. “Descriptive Statistics.” In Wikipedia; The Free Encyclopedia. Available: https://en.wikipedia.org/wiki/Descriptive_statistics. Accessed May 23, 2021.

———-. 2021c. “Statistical Inference.” In Wikipedia; The Free Encyclopedia. Available: https://en.wikipedia.org/wiki/Statistical_inference. Accessed May 23, 2021.

Continue ReadingDescriptive and Inferential Statistics

Statistical Thinking

Image by Matthias Groeneveld. Downloaded from pexels.com

In my social media feed a couple of weeks ago, someone posted an image of a television news piece (from Detroit’s CW50) and a short paragraph under the headline “Former Detroit TV Anchor Dies One Day After Taking COVID Vaccine.” There was no actual link to a site, and the headline, image and paragraph seemed to not have been put together by the original source of the news. But the suggestion was clear: the COVID vaccine could be the cause of death. The paragraph referred to Karen Hudson-Samuels, a Detroit news producer and anchor who, indeed, seems to have died a day after taking the vaccine. Some articles on the internet quoted her husband as saying the immediate cause may have been a stroke with no clear relation to the vaccine (e.g. Nour Rahal 2021).

An off the cuff calculation would show that, given the number of people in the US who die every day and the number or COVID vaccinations taking place every day, particularly for the population over 65 (Karen Hudson-Samuels was 68), chances are that there will be people dying the day after taking a COVID vaccine, for completely unrelated reasons. For example, as of Feb 27 there were approximately 12 million 65-74 year olds with at least 1 dose of the vaccine (CDC 2021). If there are at least 31 million 65-74 year olds in the country (there were more in 2019 according to the Census Bureau, USCB 2020) and if there were 75 days of vaccination between December 14 (day of first year of vaccination in the US) and February 27, the chances of a 65-74 year old receiving the first dose of the vaccine on any given day during that period was approximately 0.5% (12 million divided by 75 days out of 31 million). The likelihood actually gets greater towards the end of the period, when Karen Hudson-Samuels received it, because the number of 65-74 year olds who have not yet received their first dose decreases (the pool left to receive the dose keep getting smaller), assuming vaccination continues at the same pace. According to the CDC, the mortality rate of 65-74 year olds in the US in 2019 was approximately 1.7% (Kochanek et al, 220). Divided by 365 days, that means approximately 0.0047% of 65-74 year olds died on any given day for causes unrelated to COVID (COVID was not present at the time). If the same holds true in 2021, the likelihood that a 64-75 year old died the day after receiving the first doses of the COVID vaccine is 0.5% (chance of receiving a vaccine on any given day) x 0.0047% (chance of dying of an unrelated cause on any given day). That equals 0.000024%, or approximately 1 in 4 million. That seems like a very low chance. But if there are over 30 million 65-74 year olds in the US, that likely happened in over 7 cases between December 14 and February 27. And there were likely 7 more who died the same day of the vaccine, and 7 more two days after and so on.

The numbers above may be a bit off and the calculations assume receiving a COVID vaccine and dying of a non-related cause are independent events. This may not be the case if, for example, someone with a life threatening underlying health condition would be more likely to get a vaccine. In this case the chances of observing someone dying the day after receiving a vaccine would be even larger. On the other hand, if the fact that someone is visibly about to die makes them less likely to receive a vaccine, the chances would be smaller. But the general point should remain valid, even if the actual numbers are a bit different under varying circumstances: chances are there are several cases like that of Karen Hudson-Samuels that can be explained by pure chance, with no relationship to the COVID vaccine at all. Yet, all you need is 1 case to make the news and to persuade some people that the vaccine is likely the cause.

The post seems a clear example of the point that Leonard Mlodinow is making in the book I am currently reading, The Drunkard’s Walk: How Randomness Rules Our Lives (Mlodinow 2009). In this book he argues that random processes are all around us and play an important role in daily events. Yet, we seem to be ill equipped to recognize them and we often don’t. I am about half way through the book and so far have found most interesting his account of the development of statistical concepts and understanding over time. It is also a very pleasant read. I’ll be referring to this book again in future posts.

References

CDC (Centers for Disease Control and Prevention). 2021.  Demographic Characteristics of People Receiving COVID-19 Vaccinations in the United States. Available: https://covid.cdc.gov/covid-data-tracker/#vaccination-demographic. Accessed: 02/28/2021

Kochanek, Kenneth D., M.A., Jiaquan Xu, M.D., and Elizabeth Arias, Ph.D. 2020. Mortality in the United States, 2019. National Center for Health Statistics (NCHS) Data Brief 395, December. CDC (Centers for Disease Control and Prevention). Available: https://www.cdc.gov/nchs/data/databriefs/db395-H.pdf. Accessed: 02/28/2021

Mlodinow, Leonard. 2009. The Drunkard’s Walk. How Randomness Rules Our Lives. New York: Vintage Books. A Division of Random House.

Nour Rahal. 2021. Karen Hudson-Samuels remembered as Black TV news pioneer and Detroit history promoter. Detroit Free Press, 02/20/2021. Available: https://www.freep.com/story/news/obituary/2021/02/20/karen-hudson-samuels-black-tv-news-pioneer/6784796002/ . Accessed: 02/28/2021.

USCB (United States Census Bureau). 2020. Annual Estimates of the Resident Population by Single Year of Age and Sex for the United States: April 1, 2010 to July 1, 2019 (NC-EST2019-AGESEX-RES). Available: https://www.census.gov/data/tables/time-series/demo/popest/2010s-national-detail.html. Accessed: 02/28/2021

Continue ReadingStatistical Thinking

A Thought After Reading Daniel Kahneman’s “Thinking, Fast and Slow”

  • Post author:
  • Post category:Fan
Image by Maryam62. Downloaded from pixabay.com

I can tell that Daniel Kahneman’s book, Thinking, Fast and Slow, is one of those books that I will find myself coming back to over and over again. Why? On one hand, it provides evidence from experimental psychology for phenomena that I was already inclined to believe, that is, it appeals to my own confirmation bias. At the same time, it offers a number of insights and explanations that are new to me and eye opening. Kahneman, a psychologist, won a Nobel Prize in Economics for his work on decision-making under uncertainty. His book reflects a lifetime of learning about human judgement and is an absolute delight to read.

It’s central framework seems to revolve around the idea that our minds address problems in two distinct ways, which he describes using the metaphors of System 1 and System 2. The table below summarizes some of the characteristics of each system.

System 1System 2
FastSlow
IntuitiveDeliberate
Automatic, cannot be turned off at willEffortful and/but/therefore lazy
ImpulsiveRequires self-control
Associative and causal, but does not have the capacity for statistical thinkingRequires training for statistical thinking
Prone to bias and to believingIn charge of doubting and unbelieving

Much of Kahneman’s book is then focused on System 1 and its characteristics and biases. We learn of its need for coherence and the central role of cognitive ease in driving belief. System 2 is much less explored in the book and I was left with the desire to learn more about what can be done to strengthen our use of System 2.

Why would we want to strengthen our reliance on System 2? It is not obvious that doing so would necessarily lead to better social outcomes, if we are willing to rely on expertise.System 1’s intuitive thought draws both on heuristics (shortcuts that replace a more complex problem with a simpler one) and on expertise (recognition of information previously acquired). Becoming an expert means you can draw on your acquired information to reach better conclusions with less effort. In other words, the more we rely on experts, the more likely we are to avoid incorrect conclusions in a world governed by System 1 thinkers.

However, we are unlikely (and it is probably impossible) to seek expertise in the myriad of problems and decisions we encounter on a daily basis. And as Kahneman points out in a reference to the work of another psychologist, Daniel Gilbert, System 1 is prone to believe (Kahneman, 2011, Chapter 7). “Unbelieving” is the effortful task of System 2. If we want to form opinions and draw conclusions about much of the information we encounter on any given day, we will need to spend energy, potentially a lot of energy: we will need to be willing to lead an effortful, even if potentially fulfilling life. Those less susceptible to the System 1 biases and more prone to calling on System 2 Kahneman calls “engaged.”

Should we strive to be more “engaged?” If so, how?

References

Kahneman, Daniel, 2011. Thinking, Fast and Slow. Farrar, Straus and Giroux.

Continue ReadingA Thought After Reading Daniel Kahneman’s “Thinking, Fast and Slow”

End of content

No more pages to load