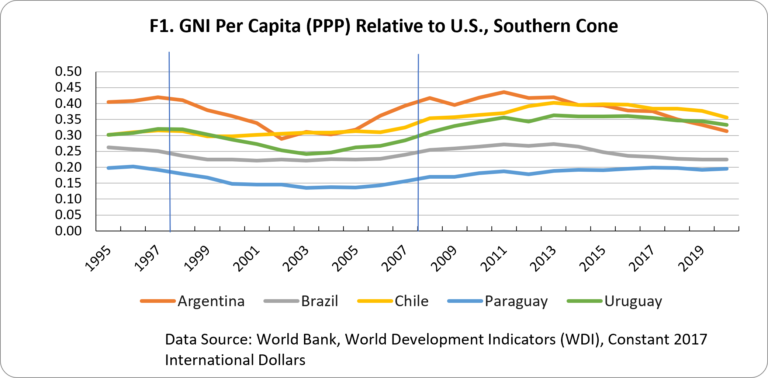
Look at the figure F1 below. It shows Gross National Income (GNI) per capita for countries in the Southern Cone of South America relative to that of the United States over a period of 26 years (1995-2020), as much data as I found available in Purchasing Power Parity (PPP). What do you see?

I see two main things:
- Paraguay’s per capita income is pretty much the same share of the U.S.’s in 2020 as it was in 1995. Chile’s and Uruguay’s are slightly higher in 2020 than in 1995, Brazil’s is slightly lower than it was, and Argentina’s is quite lower than it was.
- The biggest fluctuation in the ratio of GNI per capita’s relative to the U.S. was that of Argentina, particularly during the 10 year period between 1998 and 2008, when the ratio fell from around 0.4 to about 0.3 and then back up to 0.4 (interval shown by the vertical blue lines).
For someone interested in the economic development of the Southern Cone of South America, the two bullets are not very comforting. They suggest little to no “catch-up” happening relative to the United States. More generally, they show little movement at all in the ratio of national per capita incomes relative to the U.S., raising the question of how easy or hard it is to achieve some kind of catch-up. Even Argentina’s growth between 2002 and 2008 was likely mostly recovery from the decline between 1998 and 2002.
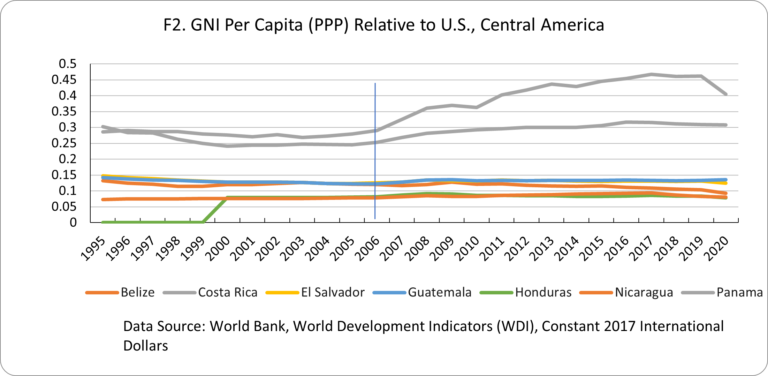
I looked at similar data for Central America, an area of particular importance to the U.S. and its foreign assistance, given the strong links of its population to the U.S. through migration flows.

Here too the main trend seems to be a relative stability in the ratio of national income of Central American countries relative to the U.S., the exception being some apparent progress being made by Panama since 2006.
Perhaps a secondary suggestion of both charts above, is that there seems to be stronger similarities in the trajectories of some countries in the same region relative to others. For example, Argentina and Uruguay. Or perhaps Brazil and Paraguay. Costa Rica, Panama’s neighbor, shows a slight upwards trend from 2006, potentially associated with Panama’s. In other words, it is worth exploring the strength of economic integration between neighboring countries (in a future post).
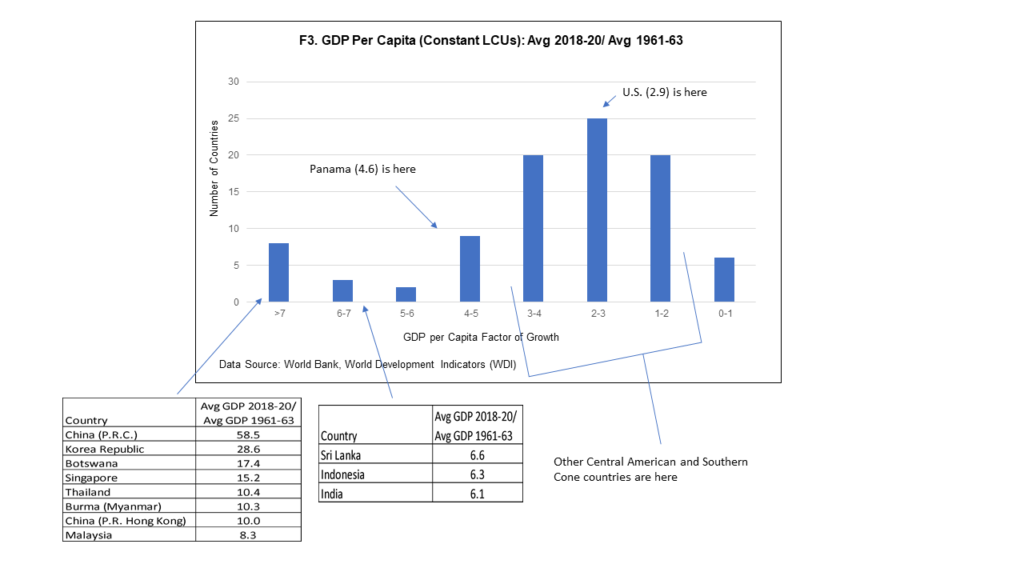
I decided to look at longer term growth trends. I used Gross Domestic Product (GDP) per capita data measured in constant local currency units (LCUs) for three reasons: the World Bank has data for over 90 countries starting in 1960 for this indicator, GDP is presumably a better indicator of productivity growth inside the country than GNI, and constant LCUs would circumvent the exchange rate issues that other units of measurement (like constant U.S. dollars or PPP international dollars) have to deal with. The drawback is that the absolute measures of output are not comparable between countries. It only makes sense to use LCUs to compare growth rates. I divided the average GDP per capita of a country between 2018-2020 by the average for that same country between 1961-1963. The result is how many times the GDP per capita of that country was multiplied over a 60 year period, in constant local currency. This is a measure of productivity growth.
Figure 3 below is a histogram for the 93 countries for which data were available. For 82 of those countries, the resulting growth factor in per capita GDP over the 60 year period was between 0 and 6. Three countries had a growth factor between 6 and 7 and the remaining 8 countries had higher growth factors, including factors of 58 for China, 28 for South Korea, 17 for Botswana and 15 for Singapore. I did not include a 94th country, Somalia, for which the factor was 551 and that seemed unreasonably large to me. I hope to explore in a future post.

Looking at these data, I again have two observations:
- If the U.S. GDP per capita was almost 3 times higher in 2020 than in 1960, all the other countries who grew their GDP per capita by multiples between 0 and 4 or 5 did no or little catching up. If your GDP per capita is, say, a quarter of that of the U.S. and the U.S. grows its GDP per capita three times over a given period, you would need to grow yours by 3 x 4 = 12 times to catch-up. If your GDP per capita was a tenth of that of the U.S., you would need to grow your GDP per capita by a multiple of 30.
- The countries that did some catching up seem geographically concentrated around China, with the exception of Botswana, as shown by the circle in the map below. The darker the red, the higher the GDP per capita growth factor. The darker the blue, the lower the GDP per capita growth factor.
F4. Map: countries in red shade are those in the first two buckets of the above histogram

Data Source: World Bank, World Development Indicators (WDI). GDP Constant LCUs and Population data. Map built using Tableau Public.
If China performed so well over the 60 year period, how come its GDP per capita today is not comparable or even larger than that of the U.S.? We do not have data in comparable units (e.g. PPP) going back that to 1960. But based on GNI data measured in current US$ (averaging exchange rates over a three year period – Atlas method). China’s GNI per capita in 1962 (oldest year) was approximately 2% (1/50) of that of the U.S. China would have had to have grown by a factor of 50 x 3 = 150 during that period to have caught-up with the U.S.
So here are some questions for potential exploration in future posts:
- How common/rare is it for a country to catch up? Are there particular circumstances that are always/often present when countries do catch up? Are these circumstances different for countries at different levels of GDP/GNI per capita?
- How good/bad are GDP and GNI as indicators of the standards of living and/or well-being of the population of a country?
- To what extent do fluctuations in exchange rates affect standards of living and well-being? How well are the different units of measurement of GDP and GNI able to remove the effect of any share of those fluctuations that do not reflect standards of living or well-being?
- What accounts for the apparent similarity in growth trajectories of some neighboring countries? Is it level of trade and/or economic integration? Is it similarity in their economies and exposure to similar external circumstances (shocks)?
- On the Southern Cone countries: Uruguay’s GNI per capita fluctuations seem to follow somewhat those of Argentina up to around 2013 or so, but then not so much. Same thing seems to have happened to Paraguay’s relative to Brazil. Was that actually the case and what could explain that?
- On Central America: what explains Panama’s performance after 2006?
References
World Bank: World Development Indicators. Available from USAID IDEA: https://idea.usaid.gov/. Accessed: January 14, 2023
